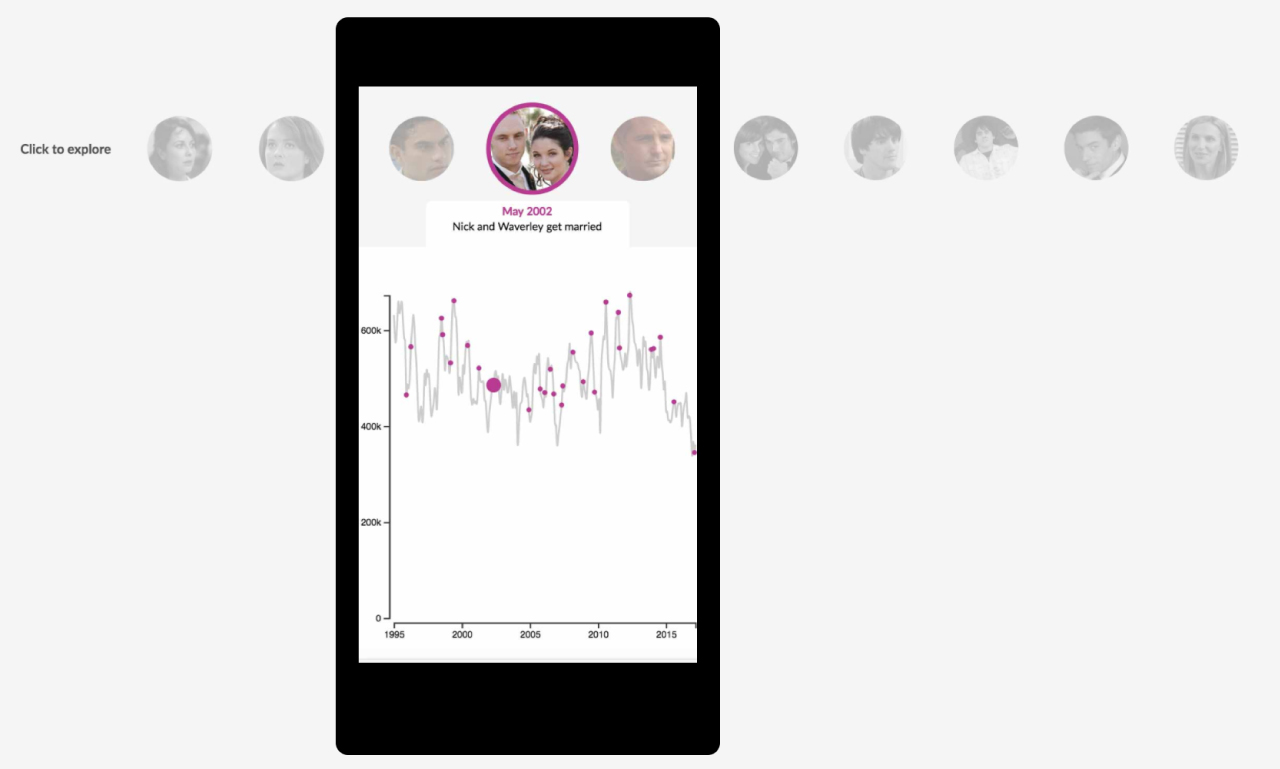
Shortland Street ratings uncovered
To celebrate Shortland Street's 25th anniversary, the Herald obtained all available ratings (Nielsen data from 1995 to present day) to track the highs and lows of Shorty Street. I created an interactive line chart to visualize the dataset. I combined D3 with React to construct the chart components and I used Sass for general styling.
UX, Design, Development, Data visualization